ReferenceConsole
Debug Mode
Inspect the API calls the console makes to the GoodMem server
Debug Mode
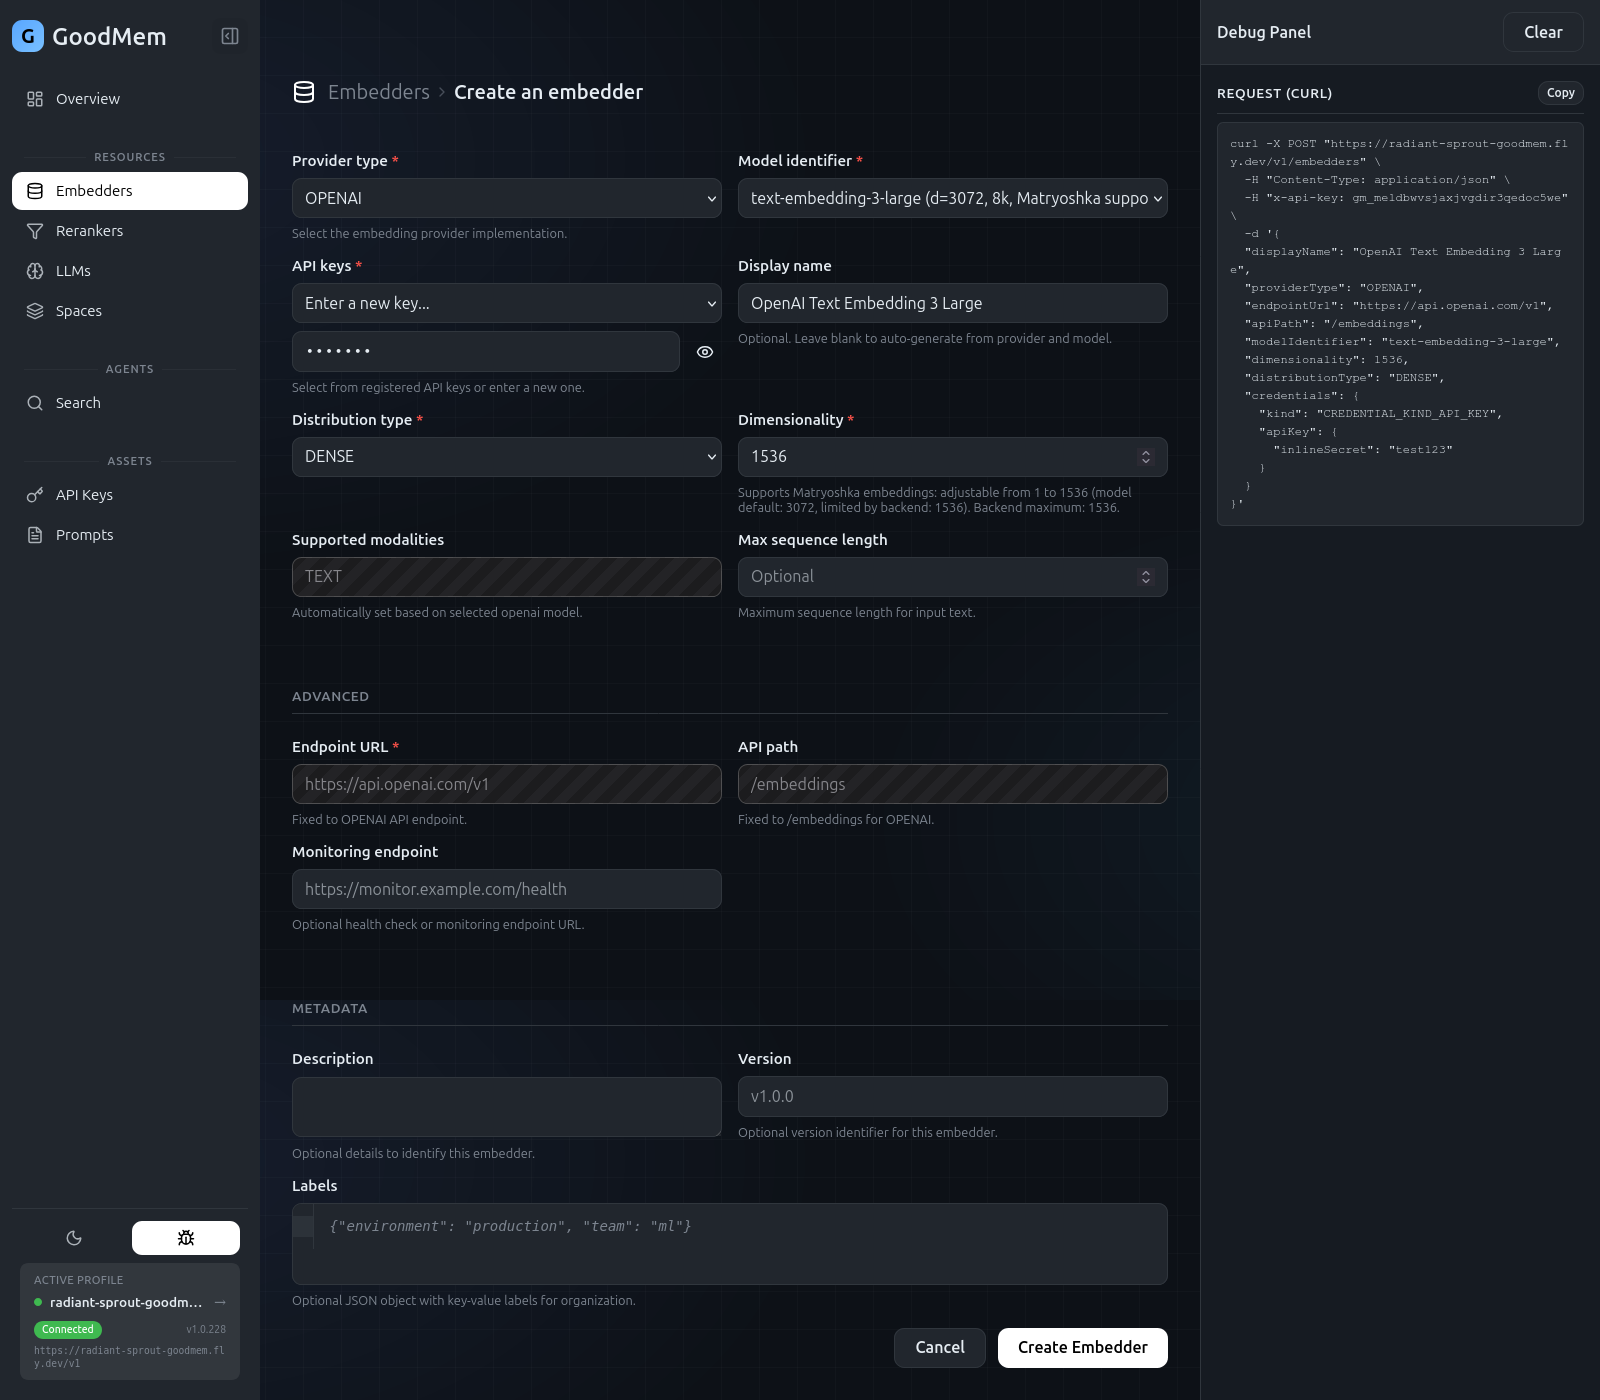
Debug mode exposes the raw API calls that the console makes behind the scenes. When enabled, every create, update, or search action shows the equivalent cURL command that you can copy and run from a terminal.
Enabling Debug Mode
Toggle the debug switch in the console interface. Once enabled, a debug panel appears below forms and search results whenever the console makes an API call.
What It Shows
The debug panel displays:
- cURL command — a ready-to-paste command that reproduces the exact API call, including headers, request body, and endpoint URL.
- Response data — the raw JSON response from the server.
When to Use It
Debug mode is useful in several scenarios:
- Learning the API — see how console actions map to REST endpoints without reading API docs.
- Reproducing issues — copy the cURL command and share it with a teammate or in a bug report.
- Building integrations — use the generated commands as a starting point for scripts or SDK calls.
- Demos — show how the console translates a point-and-click action into an API call.
Example
With debug mode enabled, creating an embedder through the console generates something like:
curl -X POST http://localhost:8080/v1/embedders \
  -H "Content-Type: application/json" \
  -H "Authorization: Bearer gm_xxxxxxxxxxxx" \
  -d '{
    "display_name": "OpenAI Small Embedder",
    "provider_type": "OPENAI",
    "endpoint_url": "https://api.openai.com/v1",
    "model_identifier": "text-embedding-3-small",
    "dimensionality": 1536
  }'
You can copy this command, modify parameters, and run it directly — useful for automation or for understanding exactly what the console sent to the server.